Grafana
Grafana is a powerful visualisation tool that we can use to display graphics of the persisted data.
In order to read data from a CrateDB database, grafana leverages on the Grafana Datasource Plugin for CrateDB.
If you followed the Installation Guide, you have already Grafana running in a Docker container, with the crate-datasource plugin already installed.
For now, crate data sources are restricted to a single table, and Quantum leap creates one table per entity type; hence, you'll have to create one data source per entity type. If this is a problem/limitation for you, open an issue in quantumleap's repo and we can see how to work this out.
Configuring the DataSource
Explore your deployed grafana instance (e.g http://localhost:3000). If you
didn't change the defaults credentials, use admin as both user and password.
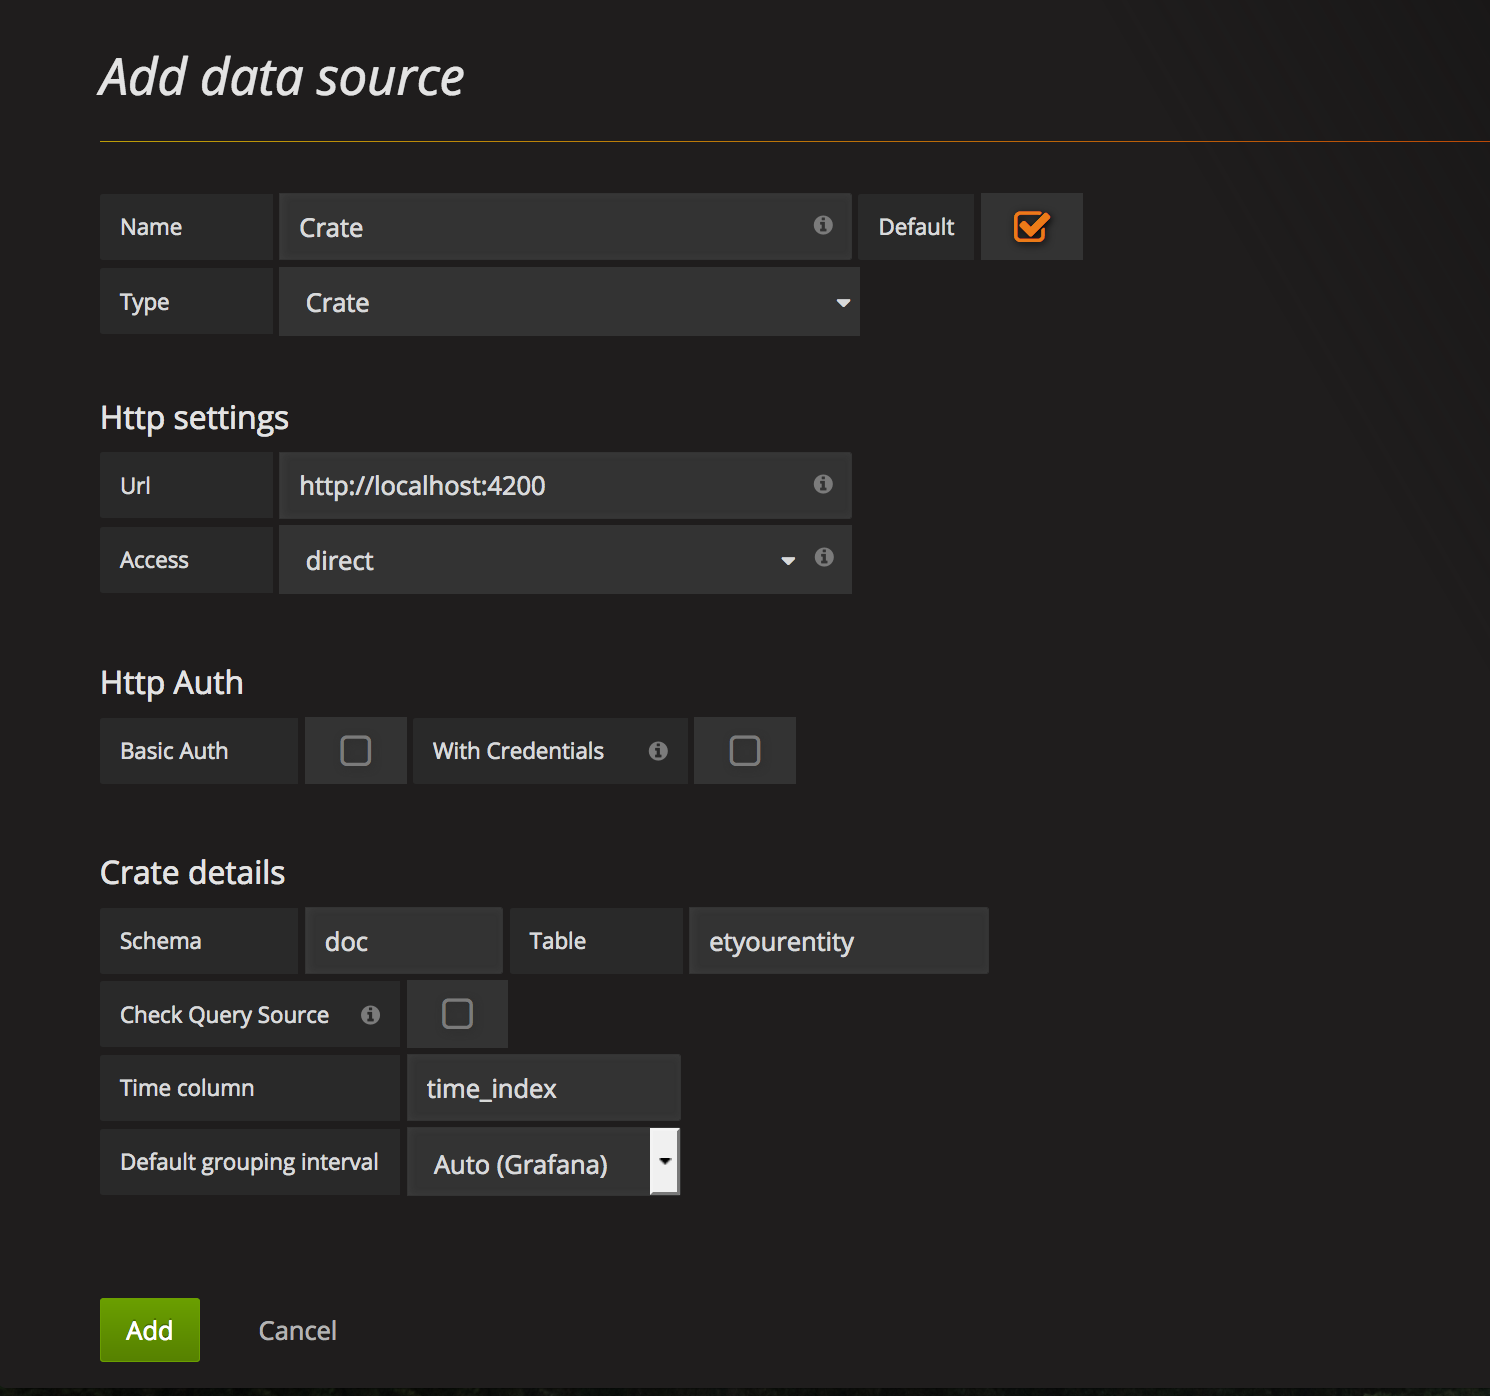
Go to Add data source and fill in the required fields, with the following observations:
- Name: This is the name you want for the Datasource. We recommend naming it after the entity type (i.e, the table you will connect to).
- Type: Use
Crate. If you don't seeCrateas an option, refer to the Troubleshooting section. - Url: The full url where cratedb was deployed.
- Access: Use
directif you're deploying everything locally. If you are deploying crate behind a proxy (as in the case of HA deployment), choose theproxyoption instead. - Schema: The schema where the table is defined. By default, crate uses
docschema, but if you are using multi-tenancy headers, the schema will be defined by the tenant of the entity type. More info in the Multi-tenancy section. - Table: The name of the table of the entity. See the Data Retrieval section to know how table names are defined.
- Time column: The name of the column used as time index. By default, it is
time_index, as explained in the Time Index section.
The following image shows an example of the datasource configuration for an
entity type called yourentity

Using the DataSource in your Graph
Having your datasource setup, you can start using it in the different visualisation widgets.
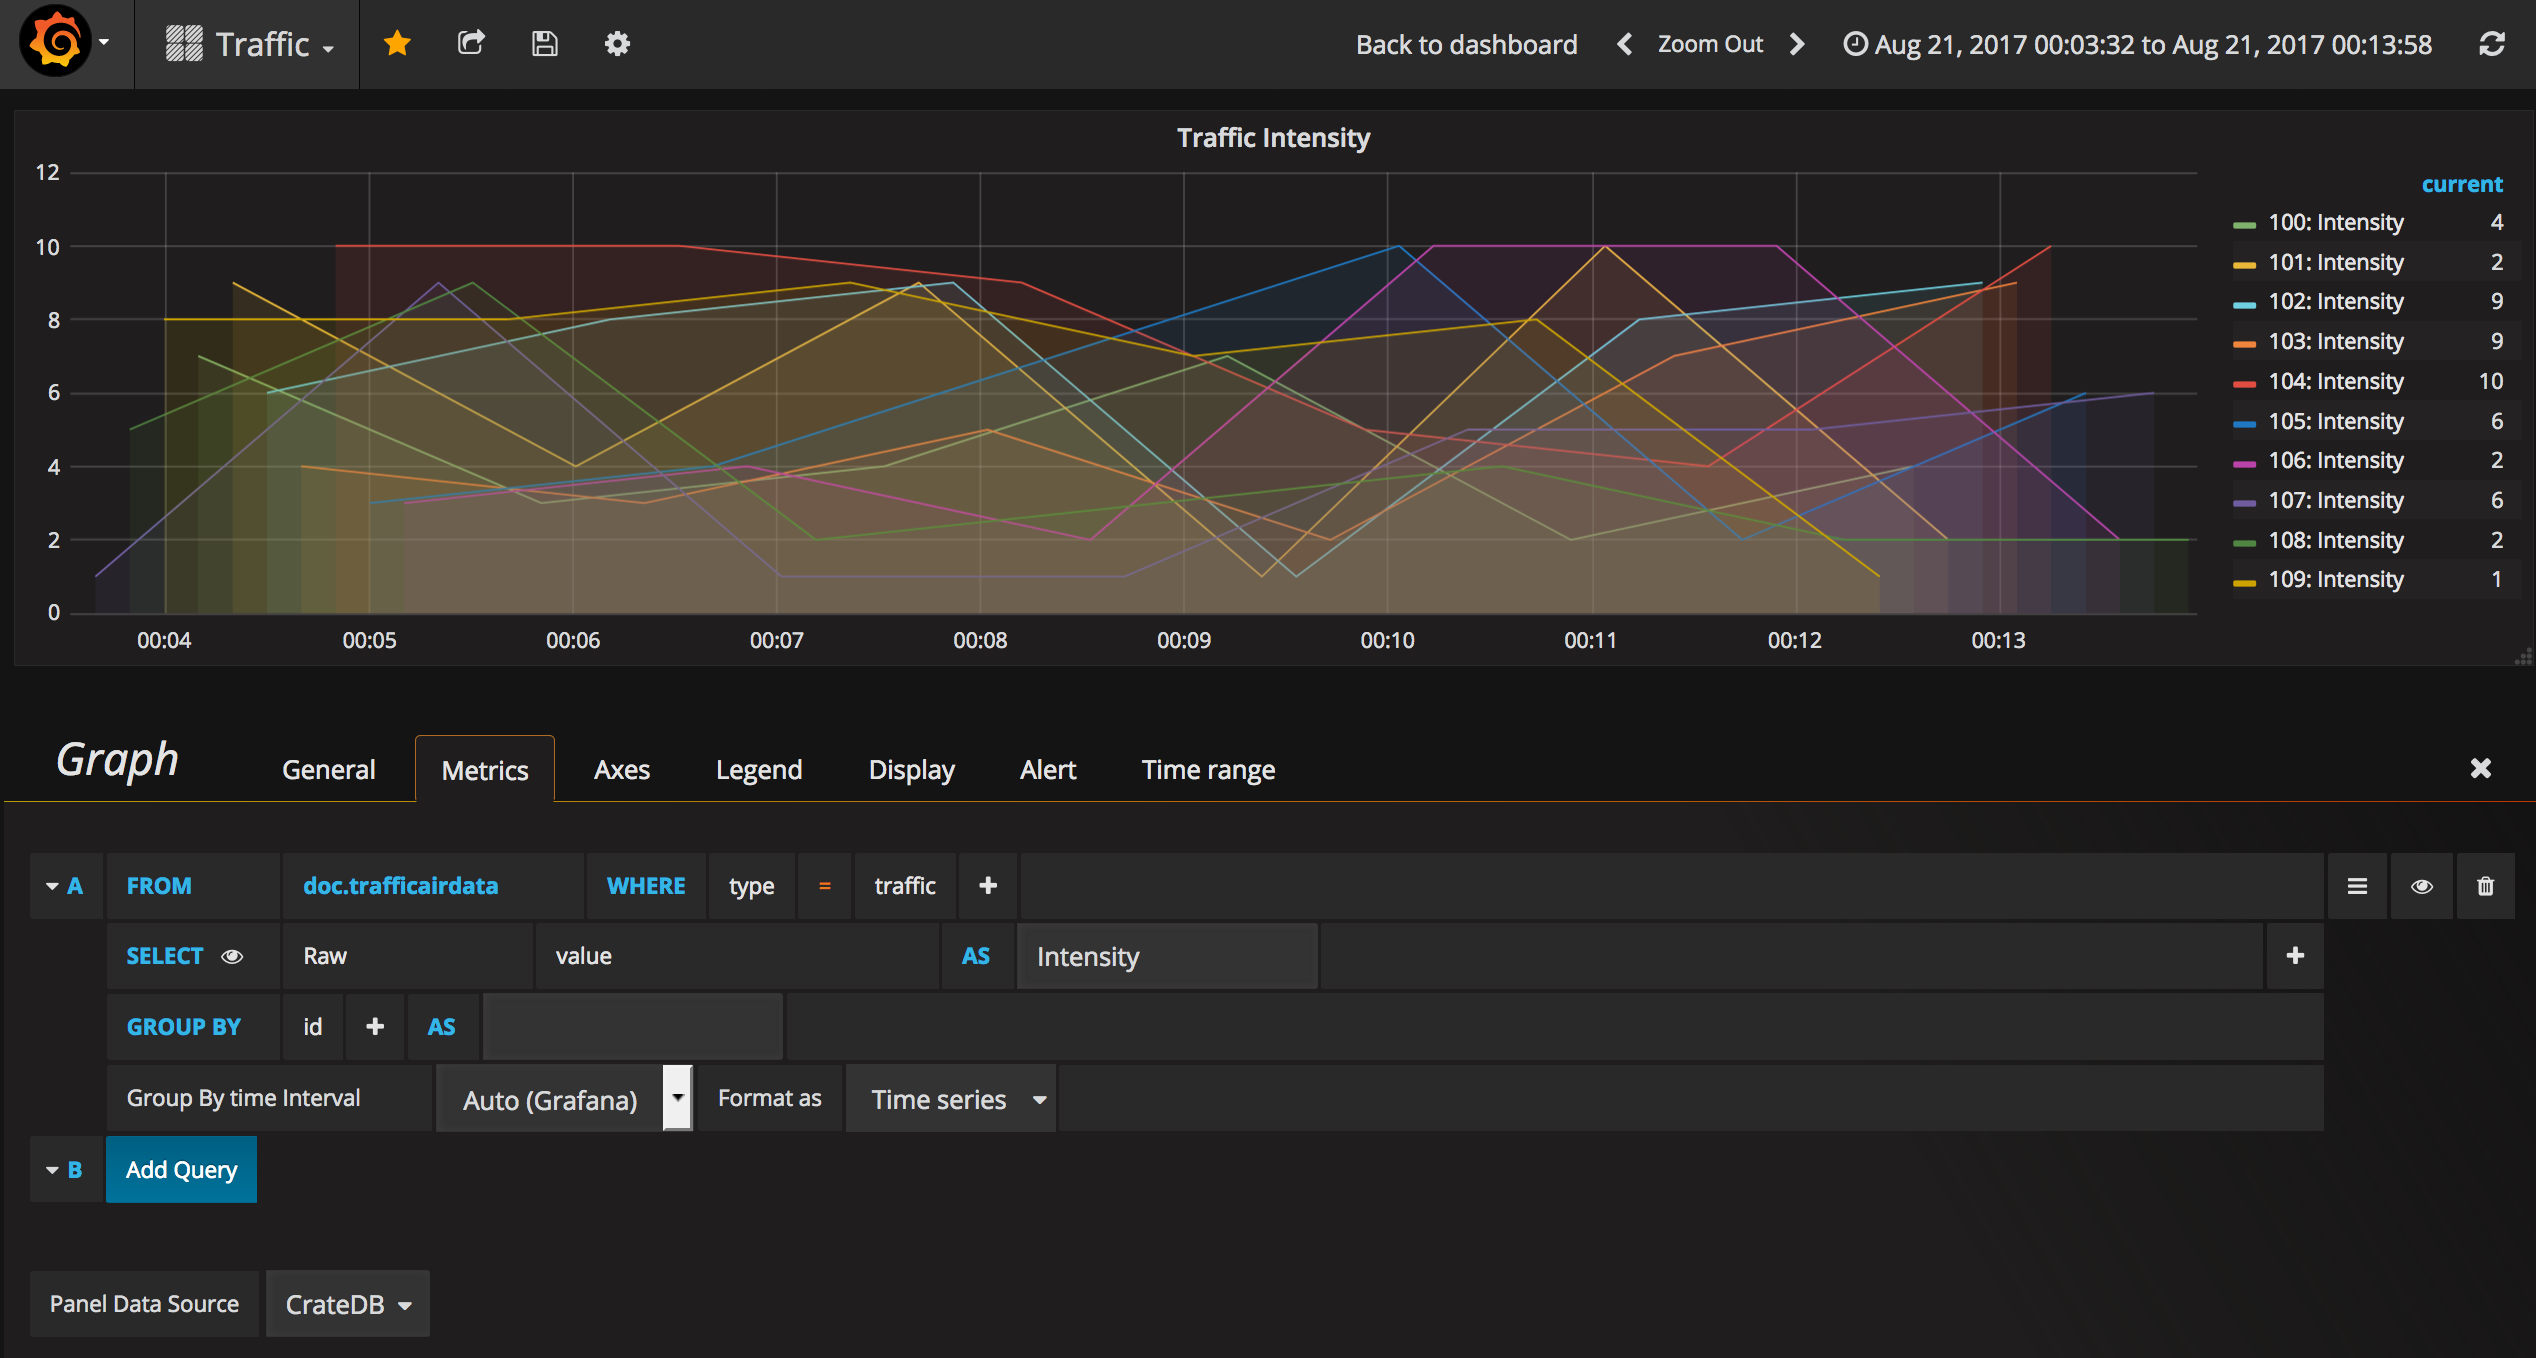
The following is an example of a Graph using a CrateDB datasource. Note the selection of the datasource (called CrateDB in this case), as well as the specification of the table in the from field. Note that the table is referenced as schema.tablename (e.g: doc.etairqualityobserved)
